
Members Home
You are not currently logged into your account!
If you have just registered, please check your email for your verification link, click that link, and then sign into your account!
- EMA Background Color
- Yellow Warning TurnBar or DPI
- Pro9 Direction Ribbon
- Pro9 Smart Indicator
- Pro9 Dashboard
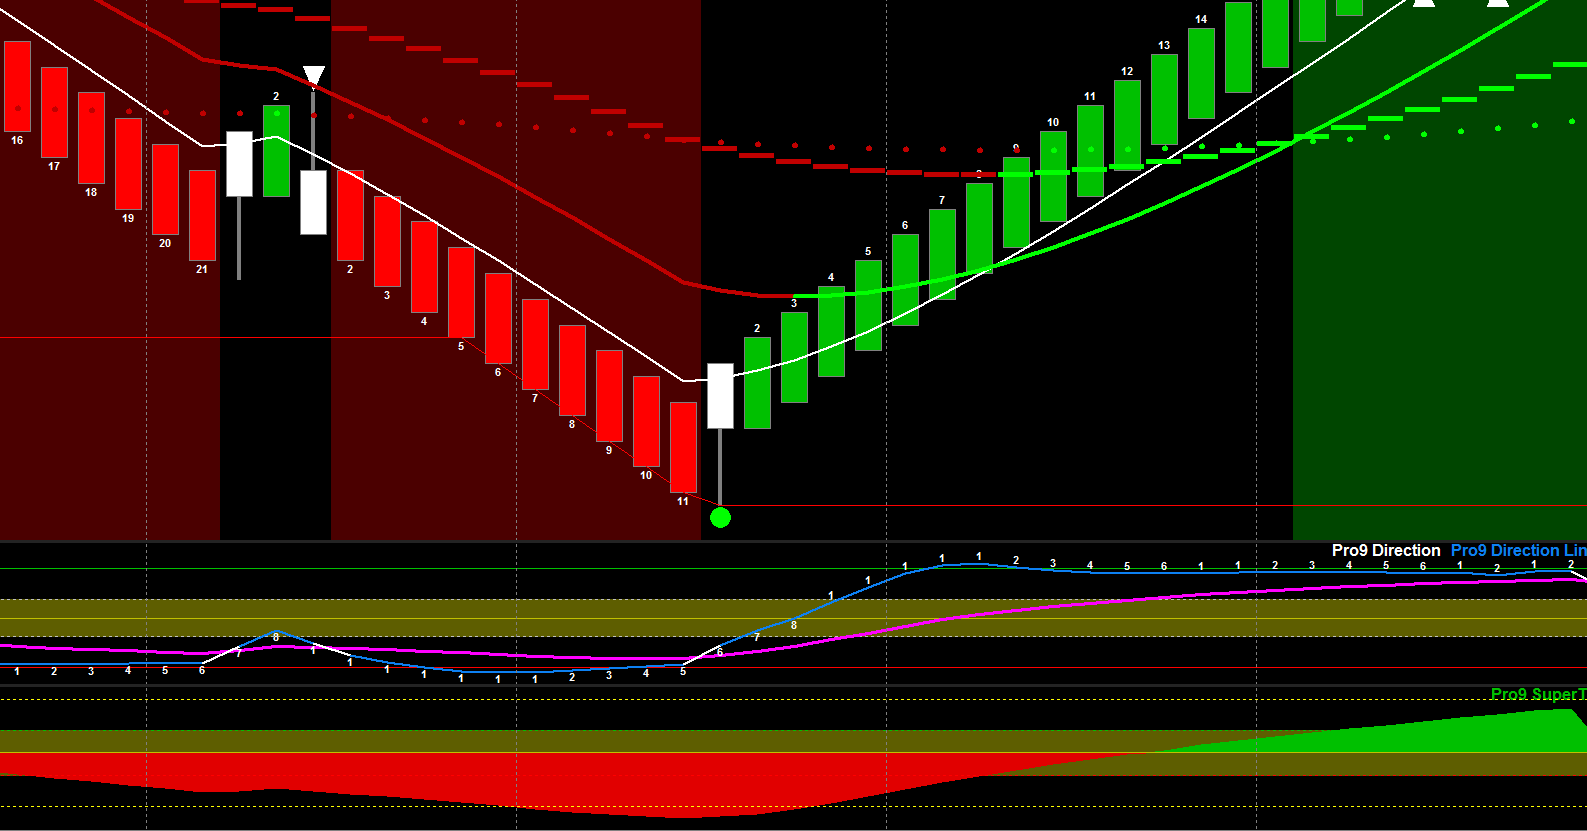
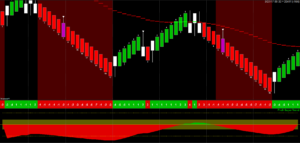
You may have noticed the background color change behind the Pro9 Bars in the top third of the screen.
The EMA Background Color indicator tells you if the EMAs are in the proper order for a trade.
The indicator is also aware of the color of the bars, so it will not show green behind red bars, or vice versa.
Finally, the background color checks the state of the Pro9 Direction and whether the Blue Line is above or below the Purple Line.
Long Example
The Background color will now be green if:
- The 10 EMA is above the 20
EMA , and the 20EMA is above the 50 EMA - The Pro9 Direction Blue Line is above the Purple Line
- The current bar is Green or a
TurnBar Long
These conditions all relate to
These indicators warn you of dangerous trading situations
Yellow TurnBar
The TurnBar will be Yellow when neither of the following conditions
- The SuperTrend is outside of its Neutral Zone
- The 50 EMA is between the high and low of the TurnBar
Provided one of the above conditions is true, the TurnBar will be White. However, if neither
Yellow DPI (Dynamic Price Indicator)
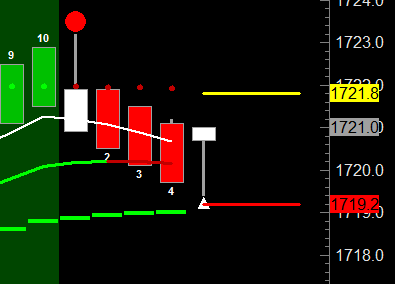
The DPI will be Yellow if the entry price is within 9 ticks of the 200 EMA. (In the direction of the trade.)
This protects us from the possibility of bouncing off the 200 EMA without hitting our target.
These are Optional Features geared toward trading markets that work well with only the Momentum Trade.
Pro9 Direction Ribbon Indicator
- This is a narrow horizontal panel based on the Pro9 Direction panel.
- When the Blue Line value is greater than the Purple Line value, the Direction Ribbon is Green.
- When the Blue Line value is less than the Purple Line value, the Direction Ribbon is Red.
- Numbers on the Direction Ribbon count how far back the most recent high or low of the blue line was, just like the yellow numbers along the Blue Line.
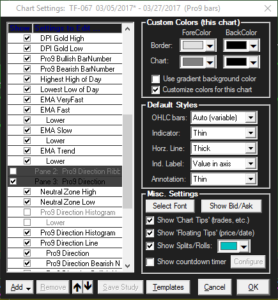
- This indicator is not on the chart by default. Right click on the chart and select EDIT chart settings, scroll down and check the box for Pane 2: Pro9 Direction Ribbon.
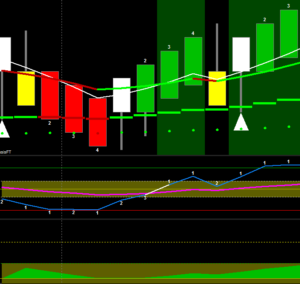
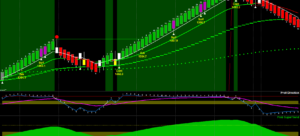
Pro9 Momentum Template
- Designed for trading the Momentum Trade only
- Uses the Pro9 Direction Ribbon Panel instead of the normal Pro9 Direction Panel
- The top panel lacks the 10, 20 and 200 EMAs, relying instead on the EMA Background Color to indicate if they are in the proper order
Green = EMAs in order for Long.
Red = EMAs in order for Short.
Gray = EMAs not in order.
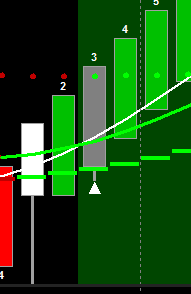
As a Pro9 Member, we have a new tool for your arsenal, the Smart indicator.
Pro9 Smart allows you to see each of the trade setups, marked on different charts, simultaneously.
It is the closest thing you can get to an automated trading system because it will literally plot the type of trade on your screen in real time, it just does not execute the trade for you.
So, if you are looking at a trade setup and not quite sure which one it is, the Smart Indicator tells you, instantly.
This is especially useful for members that trade more than one market at a time, and new members learning the details of each trade.
Have a look here:
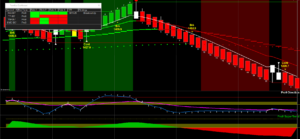
The Smart Indicator also checks market conditions. A Gray Bar is plotted when a trade is disqualified by extreme chop or consolidation. For example, a Gray Bar will plot if:
- More than half of the last 10 bars are TurnBars
- More than half of the last 10 bars had the Blue Line and the Purple Line cross
- The current bar's date and time match the previous bar, meaning it moved too fast
- We have all three classic conditions of consolidation:
- EMAs are too close together
- Purple Line is within +/-10
- The Blue Line has not made it outside +/- 135 for 6 bars
These conditions are adjustable in the Smart Indicator settings as well.
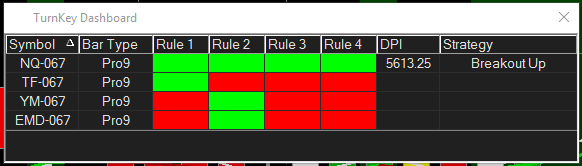
Imagine sitting at your desk, watching your charts with this software program quietly taking up very little space, showing you all the potential trades across several markets.
Each row represents a chart you have open. Watch for the color of all the boxes in a row to turn green. Once they do, all the qualifications for